In technical analysis, candlestick patterns are valuable tools used for predicting future price movements in the financial markets. These patterns provide insights into market psychology, allowing traders to identify potential reversals, continuations, or indecision points. This article aims to provide an overview of various candlestick patterns, explaining what they are and how to interpret them in technical analysis.
What is a Candlestick Pattern?
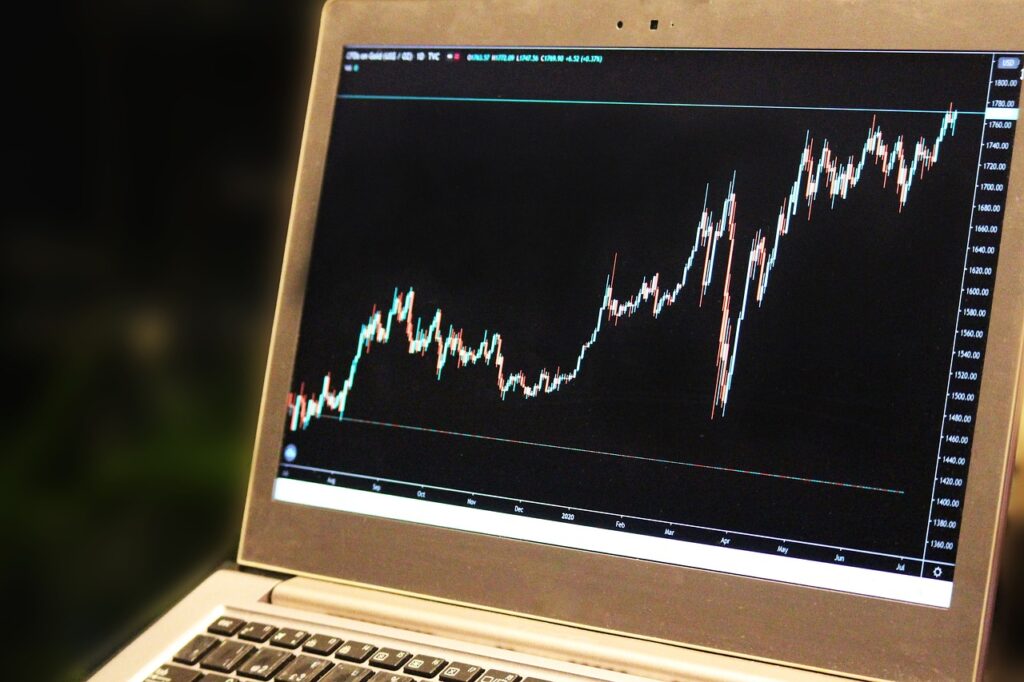
A candlestick pattern is a visual representation of price movements over a given time period. It consists of four elements: the open, high, low, and close prices. The candlestick is represented by a rectangular body and two lines, called shadows or wicks, protruding from the body. The body represents the price range between the open and close prices, while the shadows represent the high and low prices.
Interpreting Candlestick Patterns
Candlestick patterns are classified into three main categories: reversal patterns, continuation patterns, and indecision patterns. Each pattern has specific characteristics that indicate potential market direction. Here are some commonly used candlestick patterns:
| Candlestick Pattern | Definitive Features | Alternatives |
|---|---|---|
| Doji | A candle with a small body and no or very short shadows. Indicates market indecision. | Dragonfly Doji, Gravestone Doji |
| Hammer | A candle with a small body, a lower shadow that is at least twice the length of the body, and no upper shadow. Indicates a potential bullish reversal. | Hanging Man |
| Engulfing | A two-candle pattern where the second candle’s body completely engulfs the previous candle’s body. Indicates a potential trend reversal. | Dark Cloud Cover, Piercing Pattern |
| Marubozu | A candle with no shadows and a long body. Indicates strong buying or selling pressure. | Bullish Marubozu, Bearish Marubozu |
Frequently Asked Questions (FAQs)
Q: How reliable are candlestick patterns?
A: Candlestick patterns are widely used by traders and analysts due to their proven track record. However, they should not be used as standalone indicators and should be confirmed with other technical analysis tools.
Q: Can candlestick patterns be used in any financial market?
A: Yes, candlestick patterns can be applied to various financial markets, including stocks, commodities, forex, and cryptocurrencies.
Q: How can I learn more about candlestick patterns?
A: There are numerous resources available, including books, online courses, and educational websites that provide in-depth information on candlestick patterns and their interpretation.
Conclusion
Candlestick patterns are powerful tools in technical analysis, helping traders identify potential market reversals, continuations, and indecision points. By understanding the different candlestick patterns and their characteristics, traders can gain valuable insights into market psychology and make informed trading decisions. It is important to remember that candlestick patterns should be used in conjunction with other technical analysis tools for increased accuracy and reliability.